AMR All Art Index Methodology
Sebastian Duthy, Dr. James Abdey
1. Introduction
This document describes the construction of Art Market Research’s (AMR) All Art Index and the methodology underlying its calculation.
AMR uses a disruptive and innovative approach to valuing art, departing from the conventional non-appraisal methodology.
The unique nature of each piece of art renders direct comparisons problematic, while like-for-like sales are sufficiently rare and distant in time that such sparse data do not lend themselves well to developing robust price indices.
Auction sales data, being rich due to the number and frequency of transactions, offer an unbiased assessment of the value of artworks at the point of sale, as the hammer price exceeds the maximum willingness to pay of all bidders except (perhaps) the buyer.
Since artists tend to specialise in particular types of work, combining auction sales data by artist allows “brand” values to be developed with hammer prices expressing the prevailing sentiment for an artist at the time of sale. Indices therefore reveal any changes in sentiment, and hence value, of artists over time.
2. Artist Price (AP)
2.1 Overview
Just as an investment bank might determine the market value of a company’s shares before floatation on a stock exchange, AMR determines an average value for an artist whose works are put up for sale at auction. AMR calls this value the ‘Artist Price’ and makes the calculation for each artist in AMR’s large database.
2.2 Frequency
The number of lots sold by an artist within a designated timeframe establishes a frequency of sales which are assessed from month to month. The categories are divided into Frequent (≥ 60 lots sold in the sample window), Medium (11 to 59 lots sold) and Rare (≤ 10 lots sold), denoted F, M and R, respectively. An example is shown in column D in Figure 1.
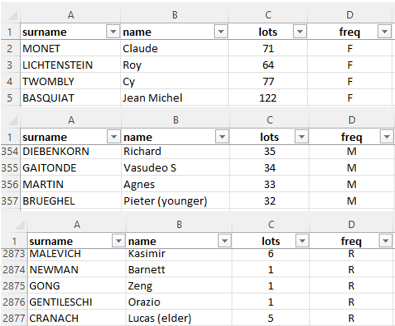
Figure 1: Example of frequency of sales categories: F = Frequent, M = Medium, and R = Rare.
Example: For a 24-month sample window of 2021-2022, the results were:
- F (frequent): 171 artists (2.47% of the total).
- M (medium) = 1,338 artists (19.36% of the total).
- R (rare) = 5402 artists (78.17% of the total).
Thinly traded artists
Most artists (approximately 80%) in a sample window are categorised as “rare” due to limited lots sold at auction. This rare class includes some of the rarest and most expensive works, so it is desirable to include these in an art price index. The All Art index includes F, M and R artists (see Section 3). For those who feel all sufficiently thinly traded artists should not feature due to the sparsity of sales, see All Art Top Traded (2.3).
2.3 All Art ‘Top Traded’
The All Art ‘Top Traded’ index is a member of the AMR All Art family of indexes and employs the same algorithms in its construction. ‘Top Traded’ refers to artists whose works are sold regularly at auction. The index excludes artists with fewer than 30 sales in a two year period.
All Art ‘Top Traded’ – Core Artists
Artists whose works are sold at least 30 times in a two year period are considered ‘core’ constituents of the All Art family of indexes. The All Art Top Traded consists exclusively of these artists which include some of the most popular and famous Painters, Sculptors, Printmakers and Photographers*. A list of these most frequently traded artists is updated and published monthly on the All Art page.
*In cases where a large number works by the same artists are consigned to a single sale, the artist may be registered as a ‘core’ artist. These sales are rare and so average values can be considered negligble within the index as a whole.
2.4 Sampling
The All Art uses a number of leading auction houses globally from which to take a sample (for a complete list of auction houses, see 3.3 Auction house list). The auction houses chosen are selective about which works of art they take on consignment and this ‘curation’ of sales provides a basis for the list of artists tracked monthly. Sales at these auction houses also represent a significant proportion of global sales by value.
Please Note: the All Art index differs from the rest of AMR’s suite of indexes containing groups of artists as these are grouped according to a fixed list of artist names.
2.5 Sample Window
12-month, 24-month and 36-month duration sample windows were tested for a group of artists.
A 24-month window was chosen for the final ‘Artist Price’ calculation. (A 12-month window suffers from excessive changes in category sizes, while a 36-month window would not capture sentiment changes sufficiently quickly.)
2.6 Weighting
A weighted average is an average that has multiplying factors to give different weights to data at different positions in the sample window. ‘Date insensitive’ and ‘date sensitive’ weighted moving averages were tested.
Weighted Moving Average – Date Insensitive
This approach attaches weights to observations which decrease arithmetically, with older observations having the smallest weights.
Methodology
Suppose there are sales for a particular artist over the previous 24-month window. For i = 1,2,…, N, where i = 1 is the oldest value and i = N is the most recent value, attach the weight:

and calculate the weighted average for the 24-month window as:

where xi is the ith sale value in the 24-month window. Examples are given in columns B and C for N = 10 and N = 12 in Figure 2.
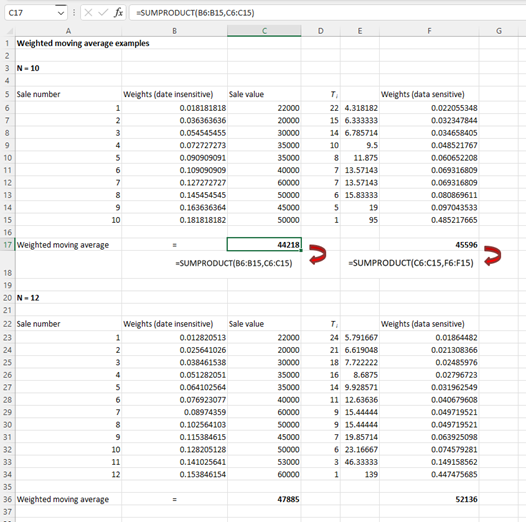
Figure 2: Examples of data insensitive and data sensitive weighted moving averages.
Weighted Moving Average – Date Sensitive
Like the date insensitive method, but this approach takes into account how recent the sales were in the 24-month window, with proportionally more weight placed on more recent sales. This differs from the date insensitive approach which treats sales as being uniformly spread over the 24-month window. Anticipating a degree of market sentiment may affect prices, the length of time which has passed should be modelled.
Methodology
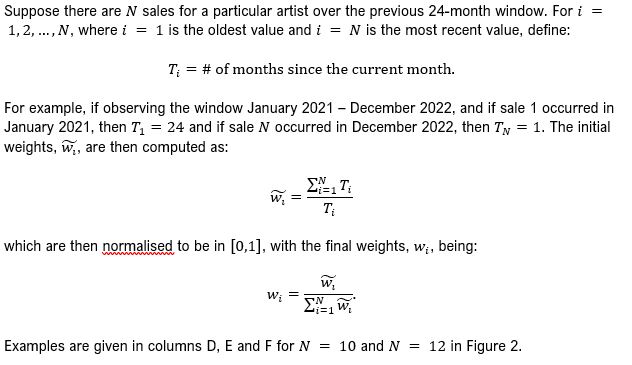
A date insensitive weighting computes different weights for works sold by artists in the same calendar month as only the order of sales is relevant. Date sensitive weighting ensures all works traded in the same calendar month are equally weighted. The date sensitive approach was chosen for the final methodology.
2.7 Smoothing
Data smoothing refers to a statistical approach of eliminating outliers from datasets to make trends more noticeable. It is achieved using an algorithm to eliminate statistical noise from datasets.
Exponential smoothing is one of many modelling techniques commonly applied to smooth data in signal processing, acting as low-pass filters to remove high-frequency noise. It can also be extended to support data with a systematic trend or seasonal component.
Methodology
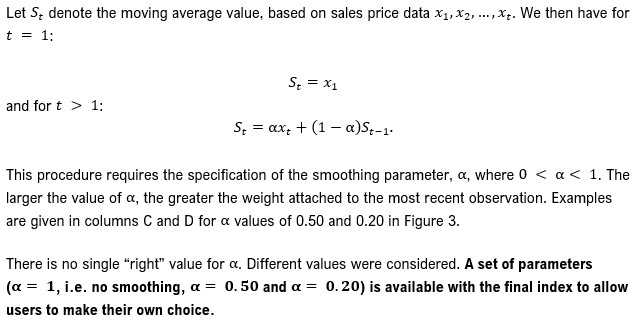
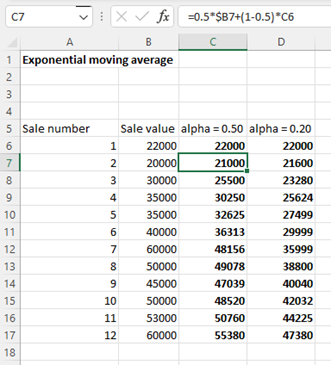
Figure 3: Exponential smoothing examples.
3. Index Methodology
3.1 Overview
In data analysis there is no single “right” methodology to employ. Methodologies vary in terms of their frameworks, albeit in all cases the objective is to present a fair approach to analysis.
Three possible ways to construct an art price index are:
- Hedonic regression-based index
- Repeat sales regression-based index
- AMR’s All Art Index.
Hedonic regression decomposes artwork into its constituent attributes (such as artist, size, subject matter), with each attribute contributing to the overall value. The criticism is that such a piecemeal approach to valuation may not be a good representation of an artwork, due to the uniqueness of each painting. Rather, a hedonic approach is better suited to more fungible assets, like real estate (floor area, number of bedrooms etc.).
Repeat sales regression uses price data from repeat sales of the same paintings, allowing the exact return to be determined. The criticism is that repeat sales may be sufficiently rare and distant in time to form a meaningful continuous index.
Due to the above limitations, we advocate the AMR All Art Index.
The AMR All Art index measures the performance of artworks sold at the leading auction houses worldwide, such as Christies, Sotheby’s and Bonhams (see Section 3.3 for the full list).
The indexes are calculated using an Artist Price (AP) algorithm (see Section 2).
Artist price (AP) figures are ordered from high to low, and all the artist prices or the first 10,000 artist prices (whichever is the lower) are eligible for inclusion in the index.
The process is repeatedly monthly, so that a new list of artists is selected each month. It should be noted that there is minimal churn in the makeup of these artists month to month (as discussed in Section 3.2).
For all the data time points, including the base period, the sum of artist prices is computed – the Underlying Monetary Value (UMV).
An initial index for time point t is then computed as 1000 multiplied by the ratio of the sum at this time point to that of the sum in the base period. This process is repeated monthly.
The entire history of the series is smoothed with factors which decrease exponentially.
At any point in time, the index represents a comparison of the sum of ‘Artist Prices’ relative to the sum of ‘Artist Prices’ in the base period.
3.2 Eligibility and Index Composition
AMR’s All Art Index employs an algorithm to select a list of APs each month.
An artist must have sold at least one of their works at auction in the previous 24-month period to be included in the monthly list of APs.
3.2.1 Index constituents retention analysis.
To test how constituents of the index might change over time, a calculation was made to track the percentage of artists who consistently appear in the list of APs over consecutive months (Fig. 4).
A sample data of 29 months was extracted for 447 artists, whose works were sold 30 times or more in a 24-month period (2018:01- 2020:05). The list of artists (comps) was compared in consecutive months – 2018:02 is compared to 2018:01 and so on. The results for the first two months were: of 447 artists in 2018:01 (total comps. column), 433 artists were present the following month 2018-02 (hit count column). See Figure 4 for full results.
Algorithm: changeIn% = 100 – (hitCount201802 / totalComps201801 * 100)
changeIn% = 100 – (433 / 447 * 100)
changeIn% = 100 – (0.96868 * 100)
changeIn% = 100 – 96.868
changeIn% = 3.132
consistency = 96.87%
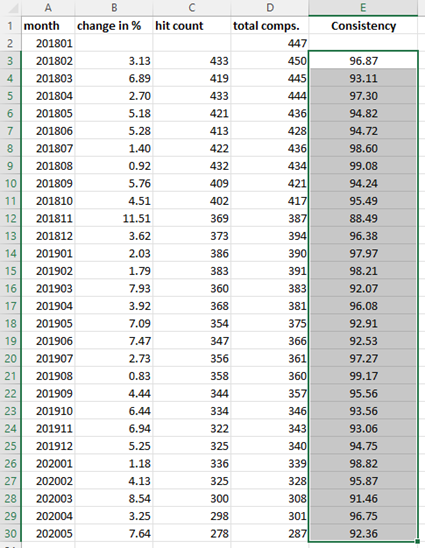
Figure 4: Index constituents retention analysis.
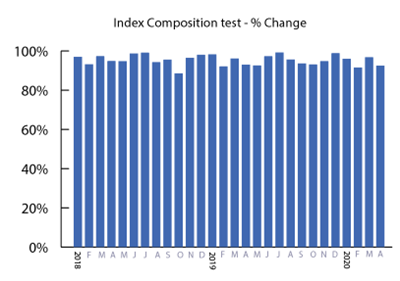
The resulting data, plotted in a chart, shows a consistency of at least 88.49% from one month to the next. This indicates reasonable stability in the core index constituents month to month (see 2.2 Frequency – Core Artists).
3.3 Auction House List
AMR tracks prices at the leading auction houses worldwide. The list of auction houses includes separate salerooms in different countries where they exist.
Percentages represent the weighting of each aucton house in 2022.
| Christie’s | 44.27% |
| Sotheby’s | 40.26% |
| Phillips | 6.74% |
| Bonhams | 1.77% |
| Seoul | 0.86% |
| Artcurial | 0.80% |
| Dorotheum | 0.61% |
| Kornfeld | 0.57% |
| Villa Grisebach | 0.45% |
| Ravenel | 0.39% |
| Heffel | 0.35% |
| Saffron Art | 0.35% |
| Tehran Auction | 0.32% |
| Lempertz | 0.31% |
| Bukowskis | 0.22% |
| Smith & Singer | 0.22% |
| Farsetti | 0.19% |
| Strauss | 0.18% |
| Claude Aguttes | 0.17% |
| Rasmussen | 0.15% |
| Tajan | 0.13% |
| Couer D’Alene | 0.13% |
| Beijing Poly Intl | 0.12% |
| China Guardian | 0.10% |
| Pandolfini | 0.09% |
| Auctionsverket | 0.06% |
| Morton Subastas | 0.06% |
| Salcedo | 0.05% |
| 33 Auction | 0.04% |
| Leonard Joel | 0.03% |
| Meeting Art | 0.01% |
| Stephan Welz | 0.01% |
| Larasati | 0.01% |
3.4 Conversion of prices to GBP
AMR records prices of works sold at auction in different countries around the world. Auction House buyer’s premium is removed to reveal the hammer price. Figures are converted to sterling on the day of sale (or day after if the sale is held on a weekend or holiday). AMR uses the Bank of England’s website for information on daily spot rates.
